
Color Laser Marking: How Color Forms on Metal with a MOPA Fiber Laser
In color laser marking, color comes from light, not paint. We explain how color forms on metal using a MOPA fiber laser, supported by optical diagrams and our own test results.
By Erden Arıkan · Mechatronics Engineer
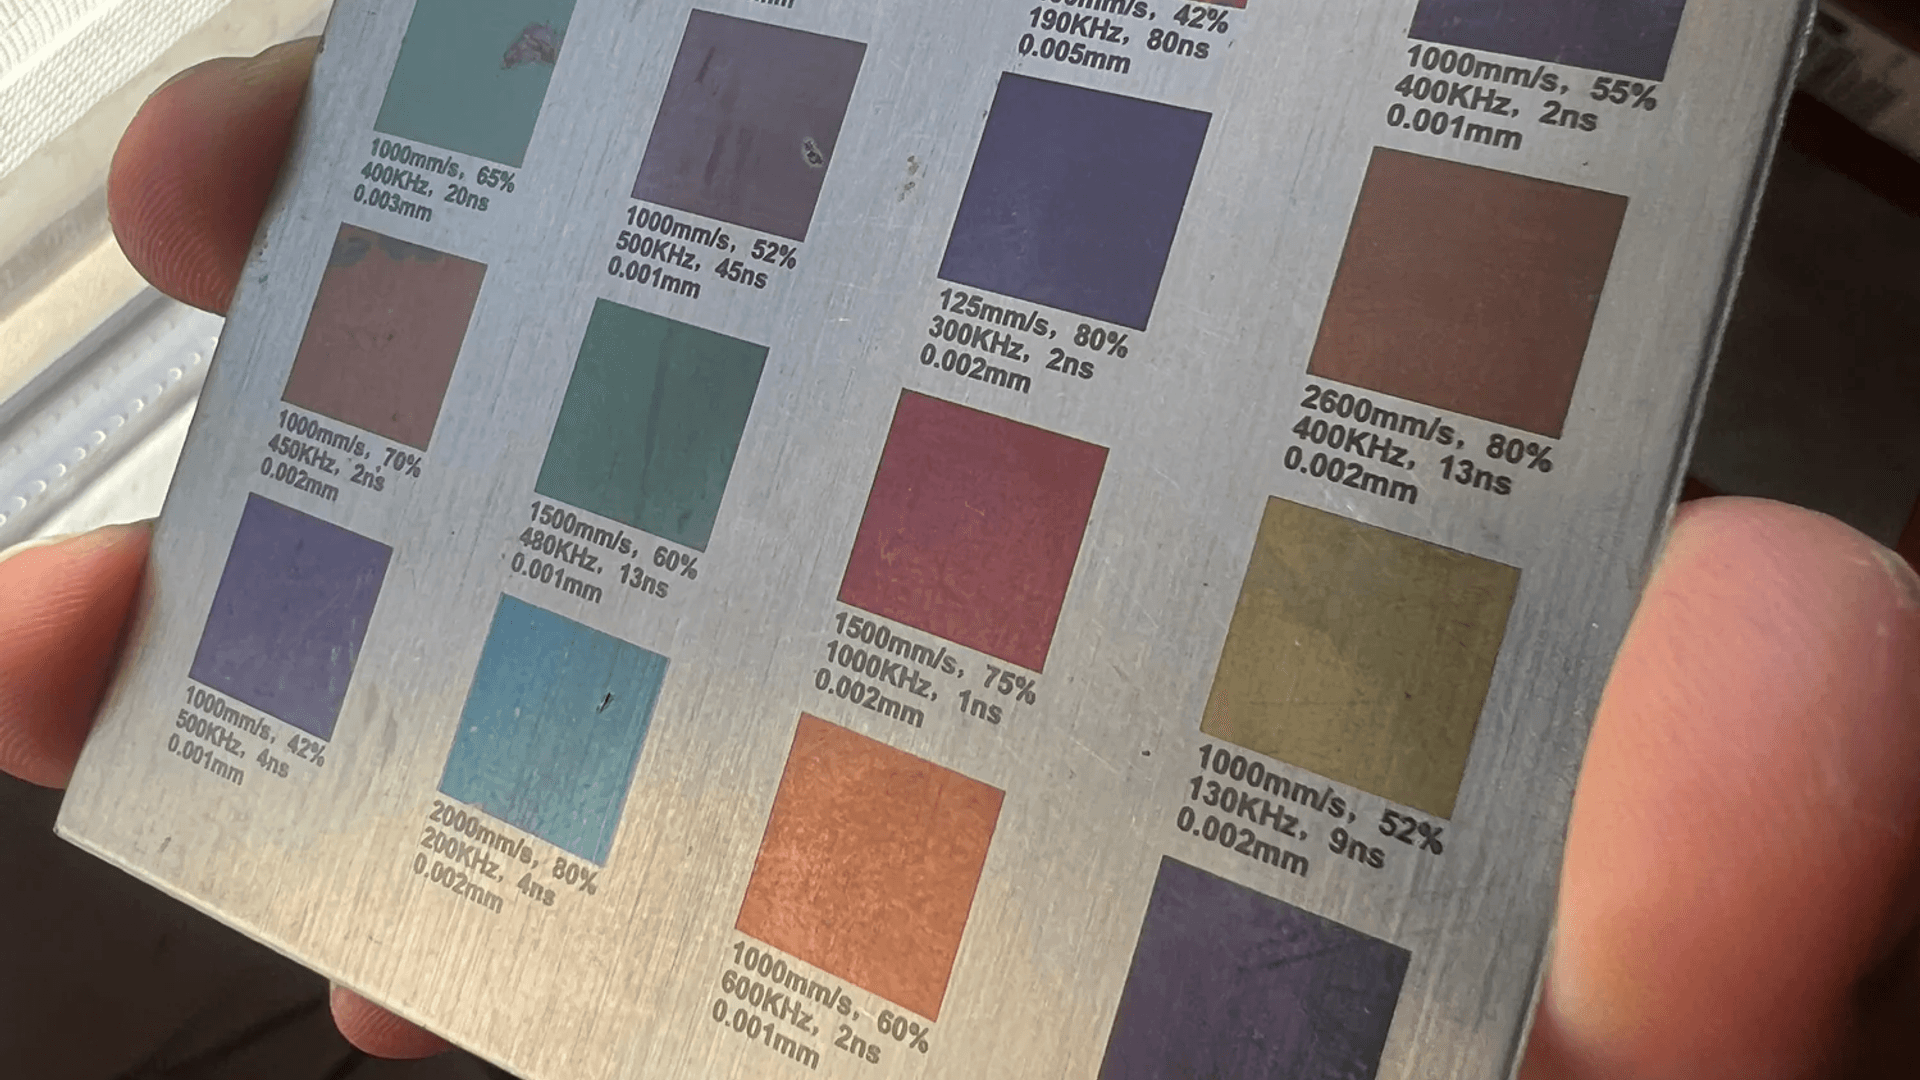
What is color laser marking?
Color laser marking is a method of producing color on metal surfaces without adding paint, ink, or coatings. A MOPA fiber laser heats the surface in a precisely controlled manner. Oxygen in the air reacts with the metal, growing a transparent oxide layer between several tens to several hundreds of nanometers thick on the surface.
The intriguing part is that the blue, purple, or turquoise we see is not the inherent color of the oxide itself. The color arises from how light reflects within this thin layer. You can observe the exact same phenomenon in soap bubbles, oil slicks on puddles, and heat tint around weld seams.
In this article, we explain the physics of color laser marking step by step. None of the diagrams were hand-drawn; each was computed using genuine thin-film optical calculations. Alongside these, we share the parameters and results of a 16-square test plate prepared in our workshop.
Color comes from light, not paint: thin-film interference
At the core of color laser marking lies thin-film interference. When white light strikes the oxide layer, it splits into two. Part of it reflects immediately from the top surface of the oxide (ray 1). The remainder penetrates the layer, reflects off the underlying metal, and emerges back out (ray 2).
The second ray travels an additional path inside the oxide. This optical path difference depends on the film thickness (d), the refractive index (n), and the refraction angle within the layer (θt):
\Delta \approx 2\,n\,d\,\cos heta_t
If the path difference equals an integer multiple of a wavelength, the two waves meet in phase, constructive interference occurs, and that color is amplified. If shifted by a half wavelength, the waves interfere destructively, canceling that color out. Since white light contains all wavelengths, at a specific thickness certain colors are reinforced while others are extinguished. The resulting mixture reaching our eyes is perceived as a single color.
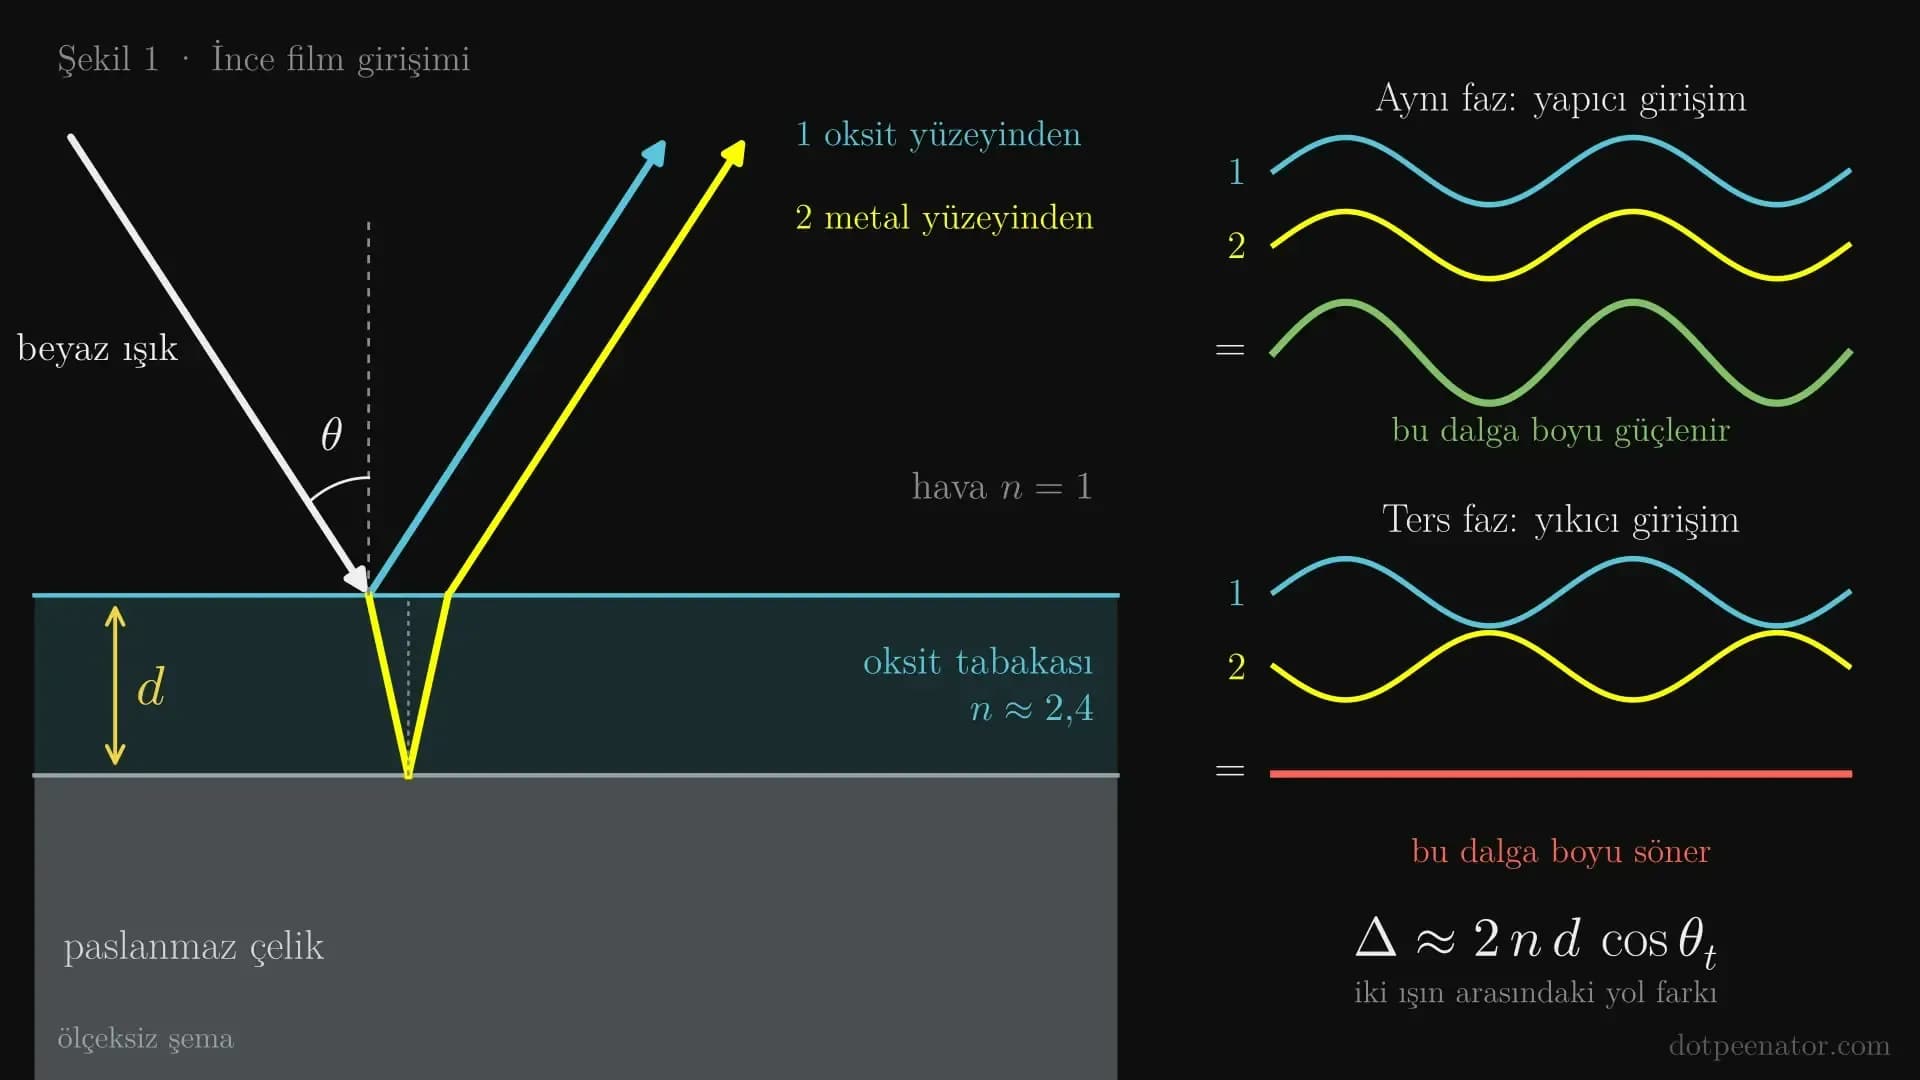
For simplicity, the phase shift introduced by reflection at the metal interface was omitted from the basic formula. The calculations behind our diagrams account for this phase shift, the optical constants of steel, and the light absorption of the oxide.
Oxide thickness determines the color
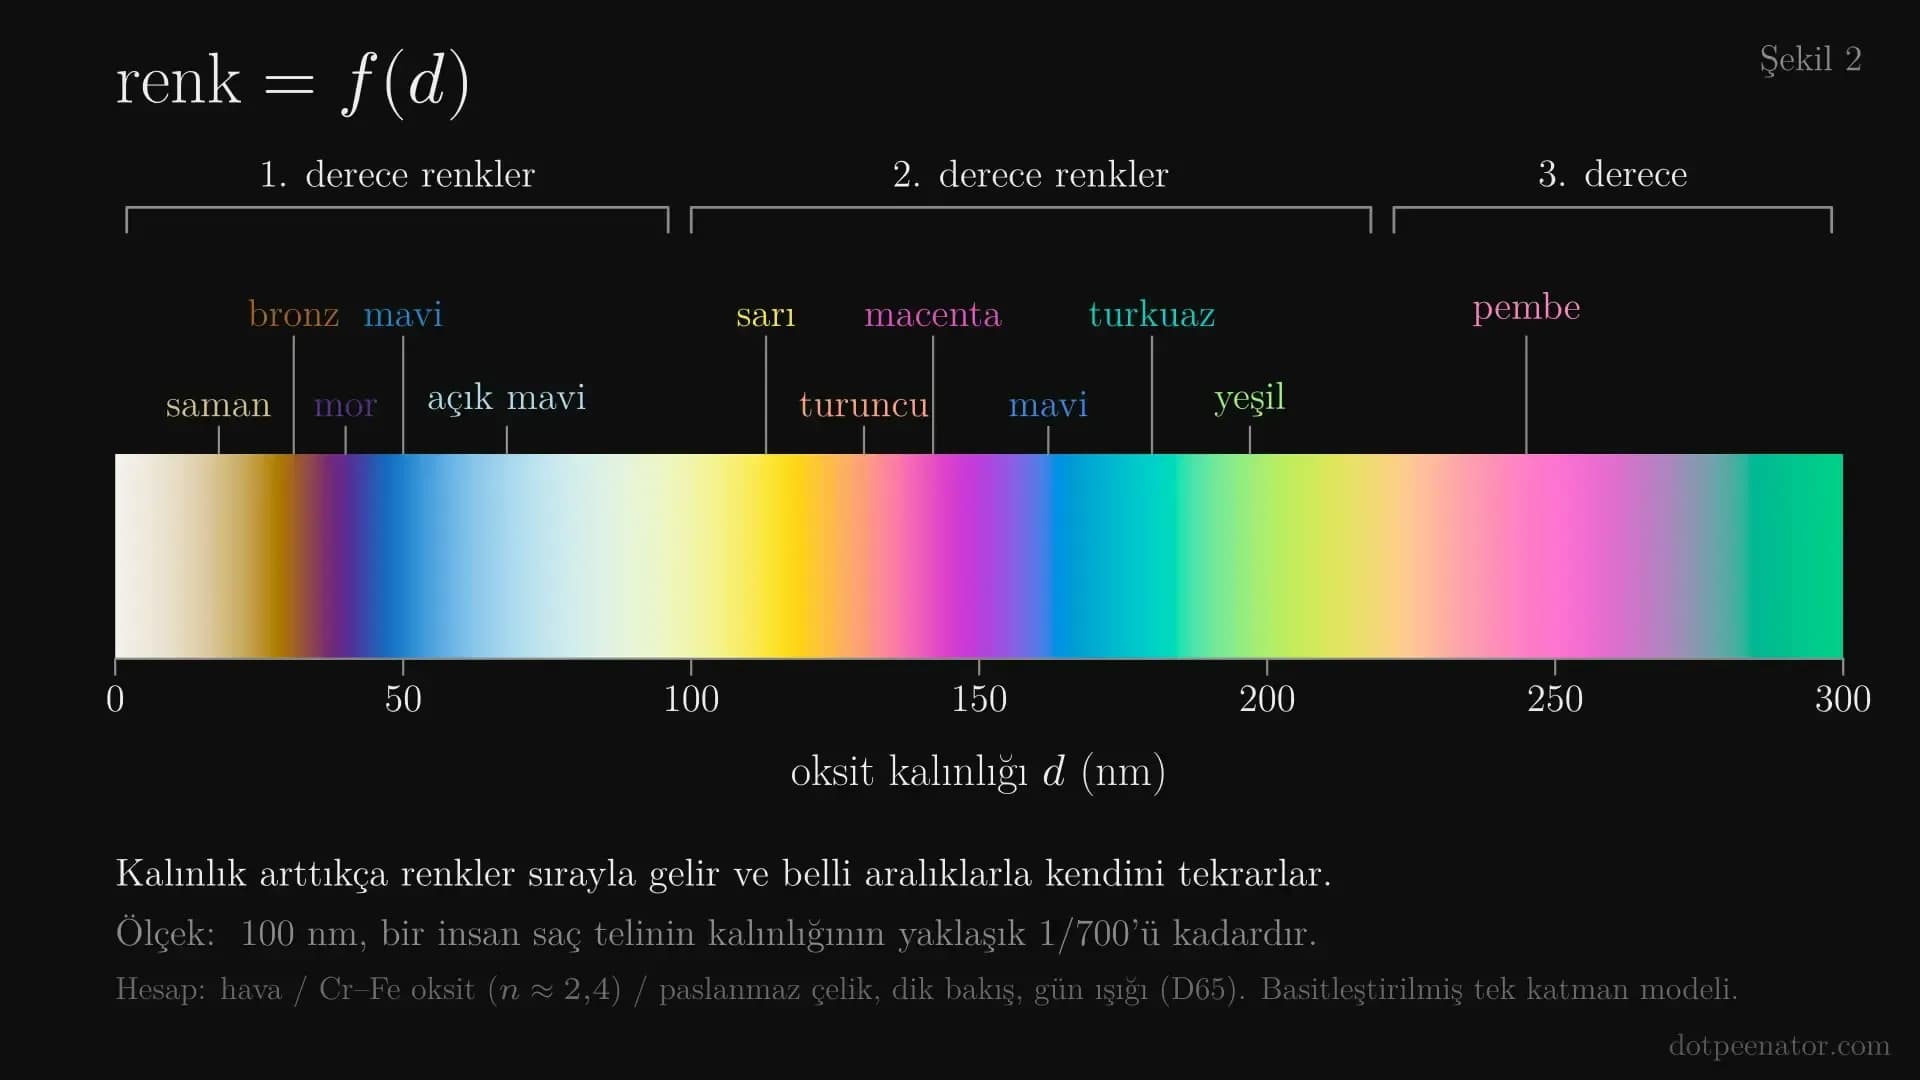
In color laser marking, each color corresponds to a specific oxide thickness. As the thickness increases, colors appear in a consistent sequence. In our simplified model viewed at normal incidence, approximately 20 nm yields straw yellow, 30 nm bronze, 40 nm purple, 50 nm blue, and 70 nm light blue.
After approximately 100 nm, the sequence begins anew: yellow, orange, magenta, blue, turquoise, and green. These are known as second-order colors. Green and turquoise appear only in this regime. Consequently, green requires a thicker oxide layer—meaning more heat input—and is more challenging to control.
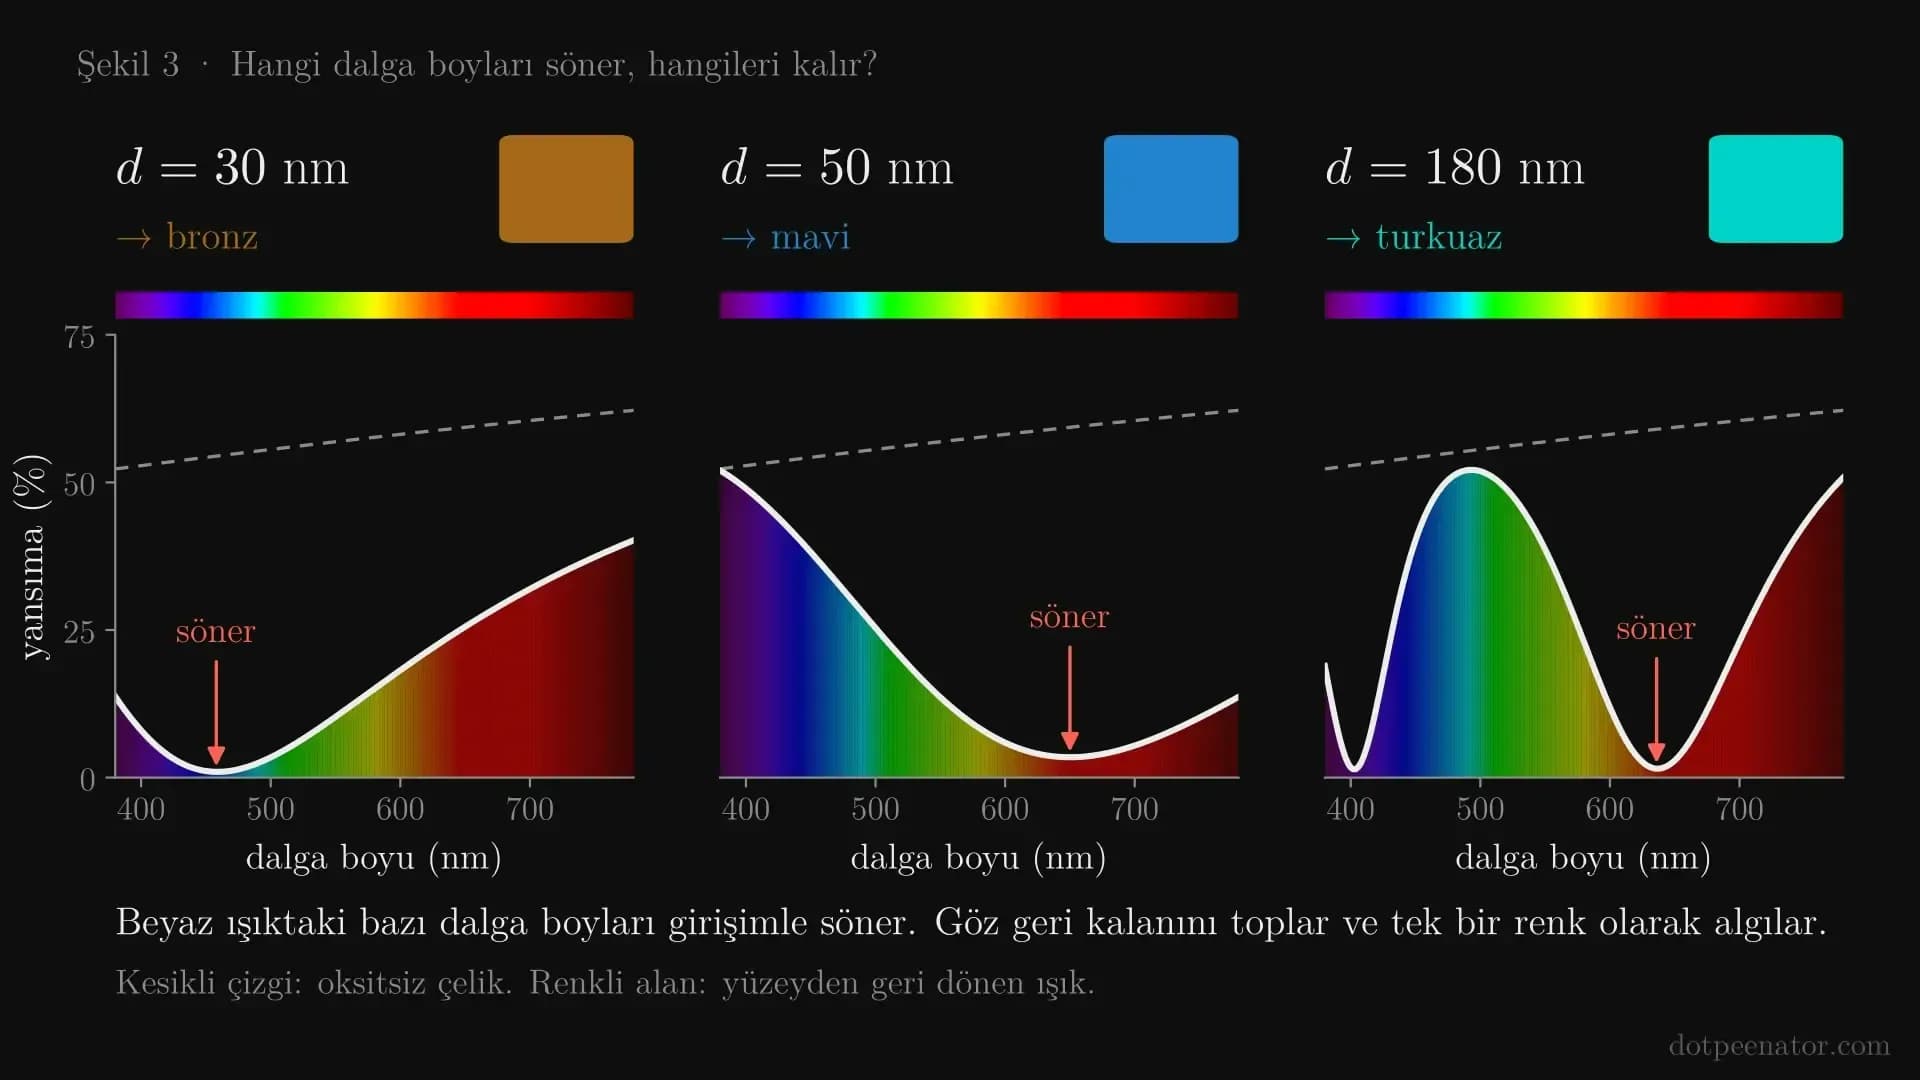
To understand why a specific color forms, one must look at the reflectance spectrum. A 30 nm layer extinguishes blue light; the remaining red and yellow produce a bronze hue. At 50 nm, red is extinguished, making the surface appear blue. At 180 nm, there are two distinct minima; the blue-green region is reinforced, producing turquoise.
Scientific note: Is it the only mechanism? The prevalent explanation in literature is thin-film interference, but it is not the only mechanism. In a study conducted on 304 stainless steel using a nanosecond fiber laser, colored layers were measured at 300–800 nm in thickness. The authors reported that in these thick and rough layers, the color stems primarily from the intrinsic colors of Cr, Fe, Mn, and Ni oxides (Lu et al., Scientific Reports, 2017). In practice, both effects operate simultaneously: when heat input is low and the layer is thin and smooth, interference dominates. In the next section, you will see compelling evidence of this on our own test plate.
Same plate, two different colors: the effect of viewing angle
The two photographs below show the exact same test plate. The parameters, squares, and material are identical; only the viewing angle and lighting direction have changed. In photo A, the squares appear predominantly dark and purple-navy. In photo B, the same squares shift to pink, turquoise, green, and orange.
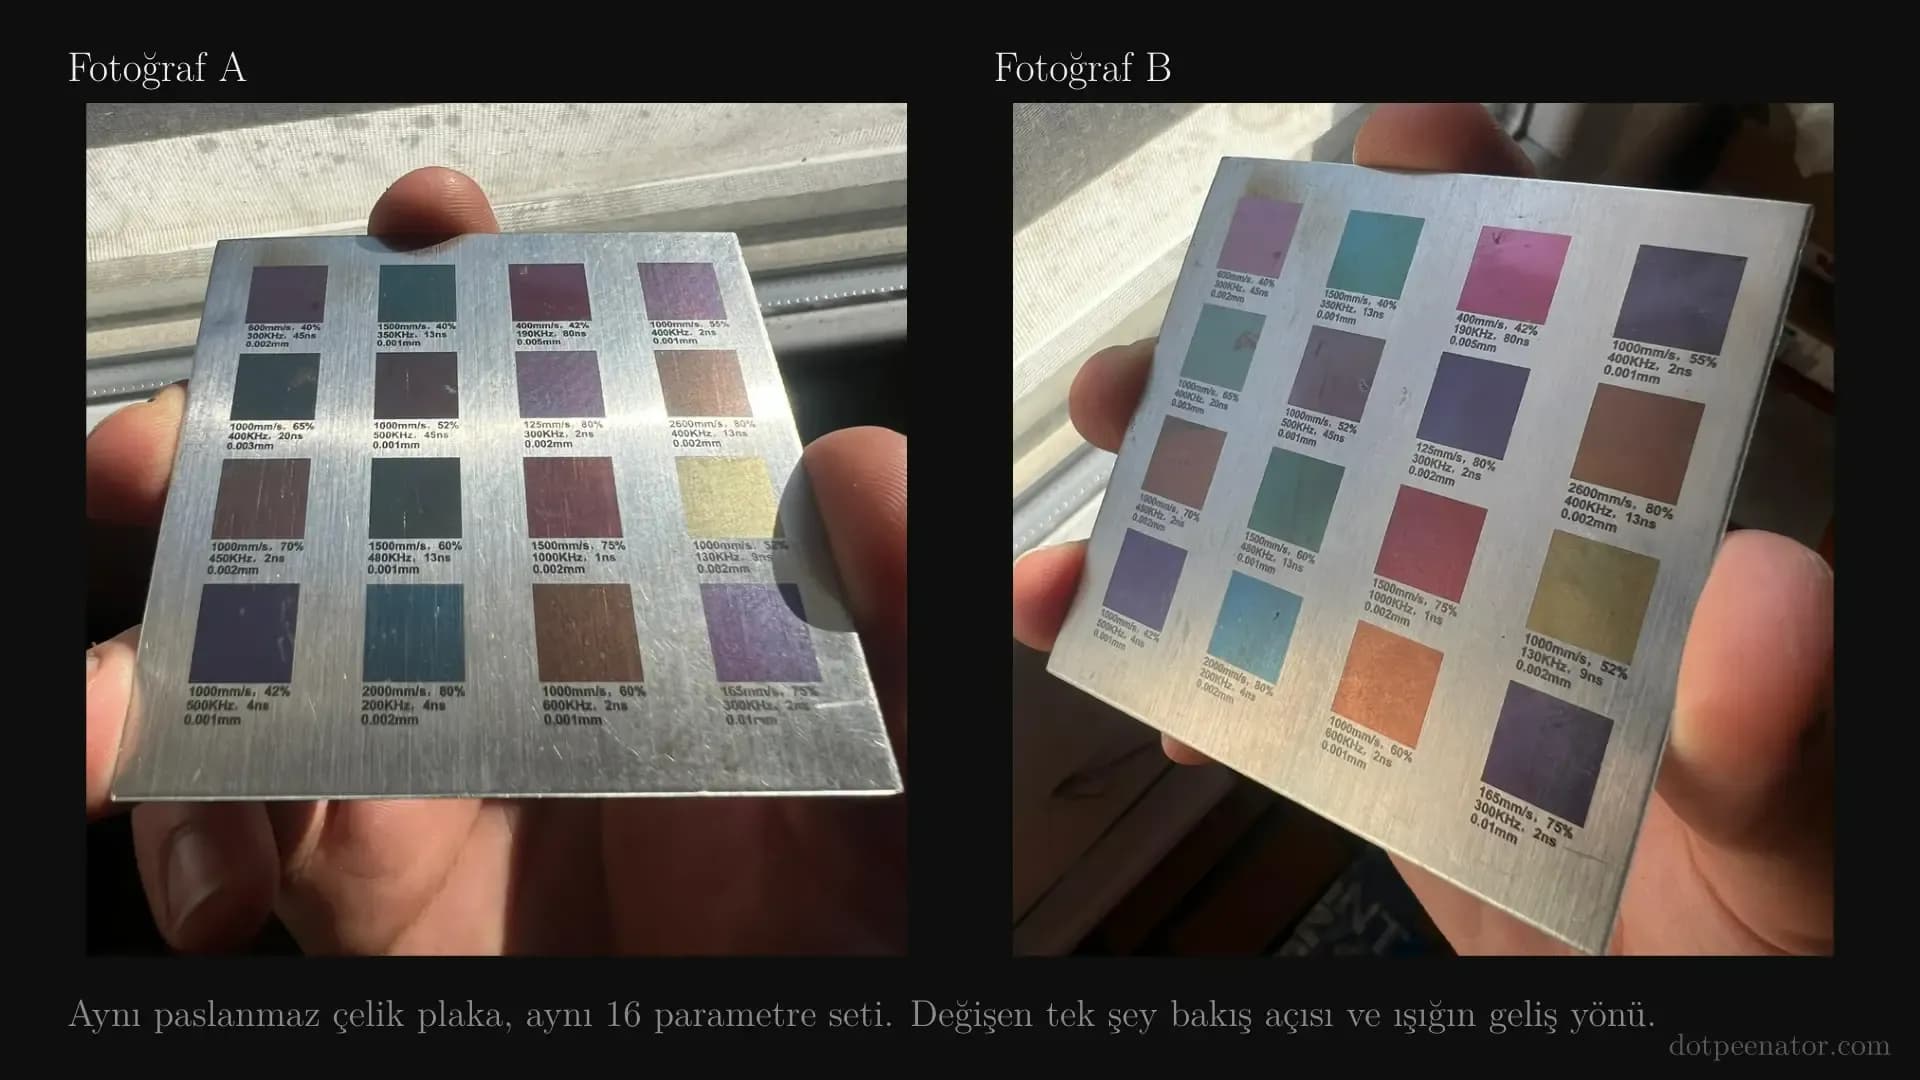
This is the signature of thin-film interference. The color of paint or pigment does not shift so drastically with the viewing angle. With interference, however, the cos θt term in the formula comes into play: at oblique viewing angles, the optical path difference decreases, and the layer behaves as if it were thinner. The spectrum shifts toward shorter wavelengths.
In our model, a 165 nm layer appears blue at normal incidence, lavender-blue at 35°, and lilac at 65°. On a real surface, the effect is even more pronounced. Surface roughness, multilayered oxidation, and the position of the light source also alter the perceived color.
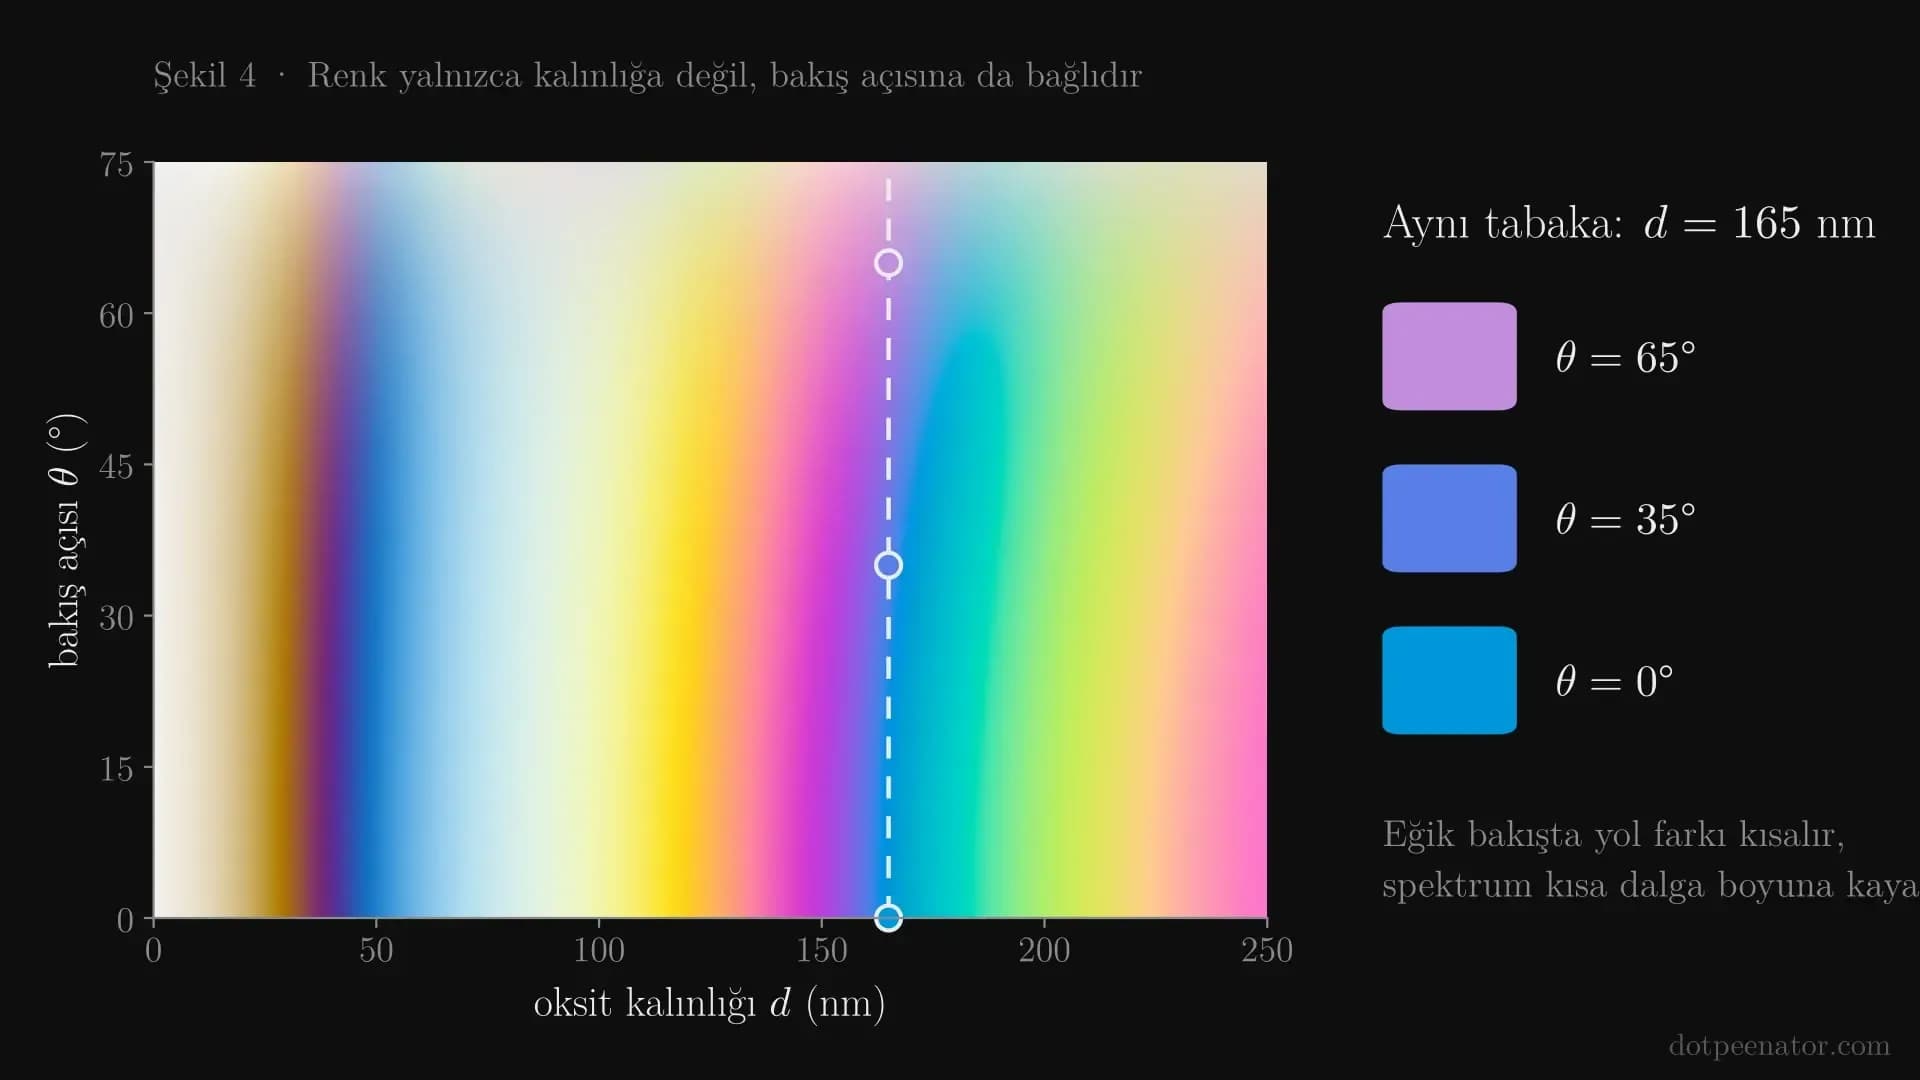
In practice, this has two crucial implications. When agreeing on color approval with a customer, define the viewing angle and lighting conditions together. When photographing products, use diffused light; direct sunlight or a single spotlight will make colors appear different from what they truly are.
Why MOPA fiber lasers for color laser marking?
MOPA stands for "Master Oscillator Power Amplifier." An electronically driven seed laser determines the pulse shape, while a fiber amplifier boosts its power. This allows pulse duration (τ) and repetition rate / frequency (f) to be adjusted independently. For example, the JPT M7 series offers a pulse duration range of 1–500 ns and a frequency range of 1–4000 kHz (HiPA Photonics Japan / JPT).
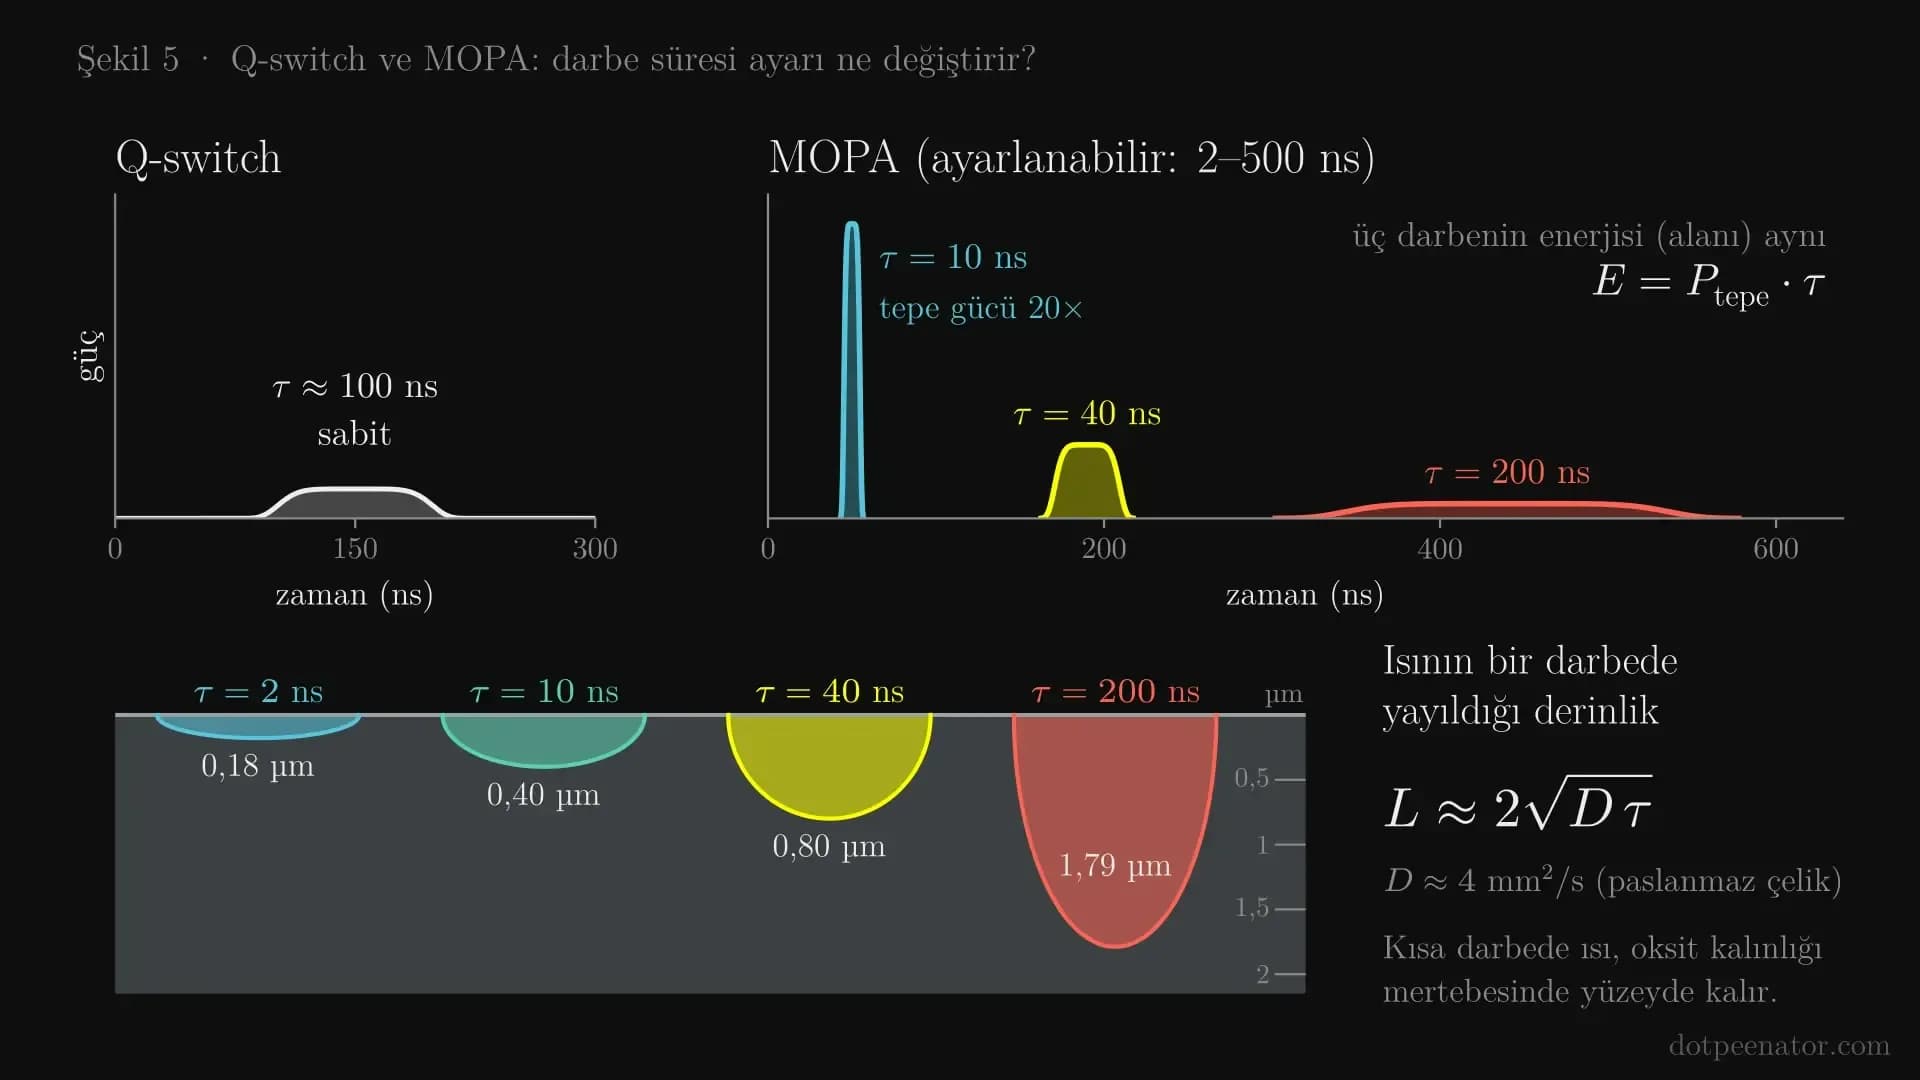
In conventional Q-switched fiber lasers, pulse duration is fixed and typically on the order of 100 ns. While some annealing colors can be achieved with a Q-switched laser using defocusing and low scan speeds, adjusting pulse duration is essential for a broad and repeatable color palette.
Why is pulse duration so critical? Two fundamental relationships explain this. At a constant average power, pulse energy depends on frequency, while peak power depends on pulse duration:
E = \frac{P_{ ext{avg}}}{f} \qquad P_{ ext{peak}} = \frac{E}{ au}
If you compress the same energy into 10 ns, peak power increases 20-fold compared to spreading it over 200 ns. More importantly, the depth to which heat penetrates into the metal changes. The thermal diffusion length per pulse is roughly given by L ≈ 2√(D·τ); in stainless steel, D is approximately 4 mm²/s.
Pulse duration | Thermal penetration depth |
|---|---|
2 ns | ≈ 0.18 µm |
10 ns | ≈ 0.40 µm |
40 ns | ≈ 0.80 µm |
200 ns | ≈ 1.8 µm |
In the thin-film model, the color-producing oxide is 0.02–0.3 µm thick. With short pulses, heat remains confined strictly to this surface scale. The oxide grows controllably while the underlying metal undergoes minimal melting. With long pulses, heat penetrates deeper, increasing melting, surface roughness, and peripheral discoloration. The key advantage of MOPA is that you can adjust both knobs independently.
mopa-fiber-lazer-q-switch-darbe-suresi.webp
Color laser marking parameters
Color does not form with a single pulse; it builds up gradually through hundreds of overlapping thermal cycles. Therefore, five parameters work in unison in color laser marking:
- Power (P): Determines the total heat input.
- Scan speed (v): Determines the dwell time of heat at a given point.
- Frequency (f): Determines pulse energy and pulse-to-pulse spacing.
- Pulse duration (τ): Determines peak power and heat penetration depth.
- Line pitch / hatch spacing (h): The distance between scan lines.
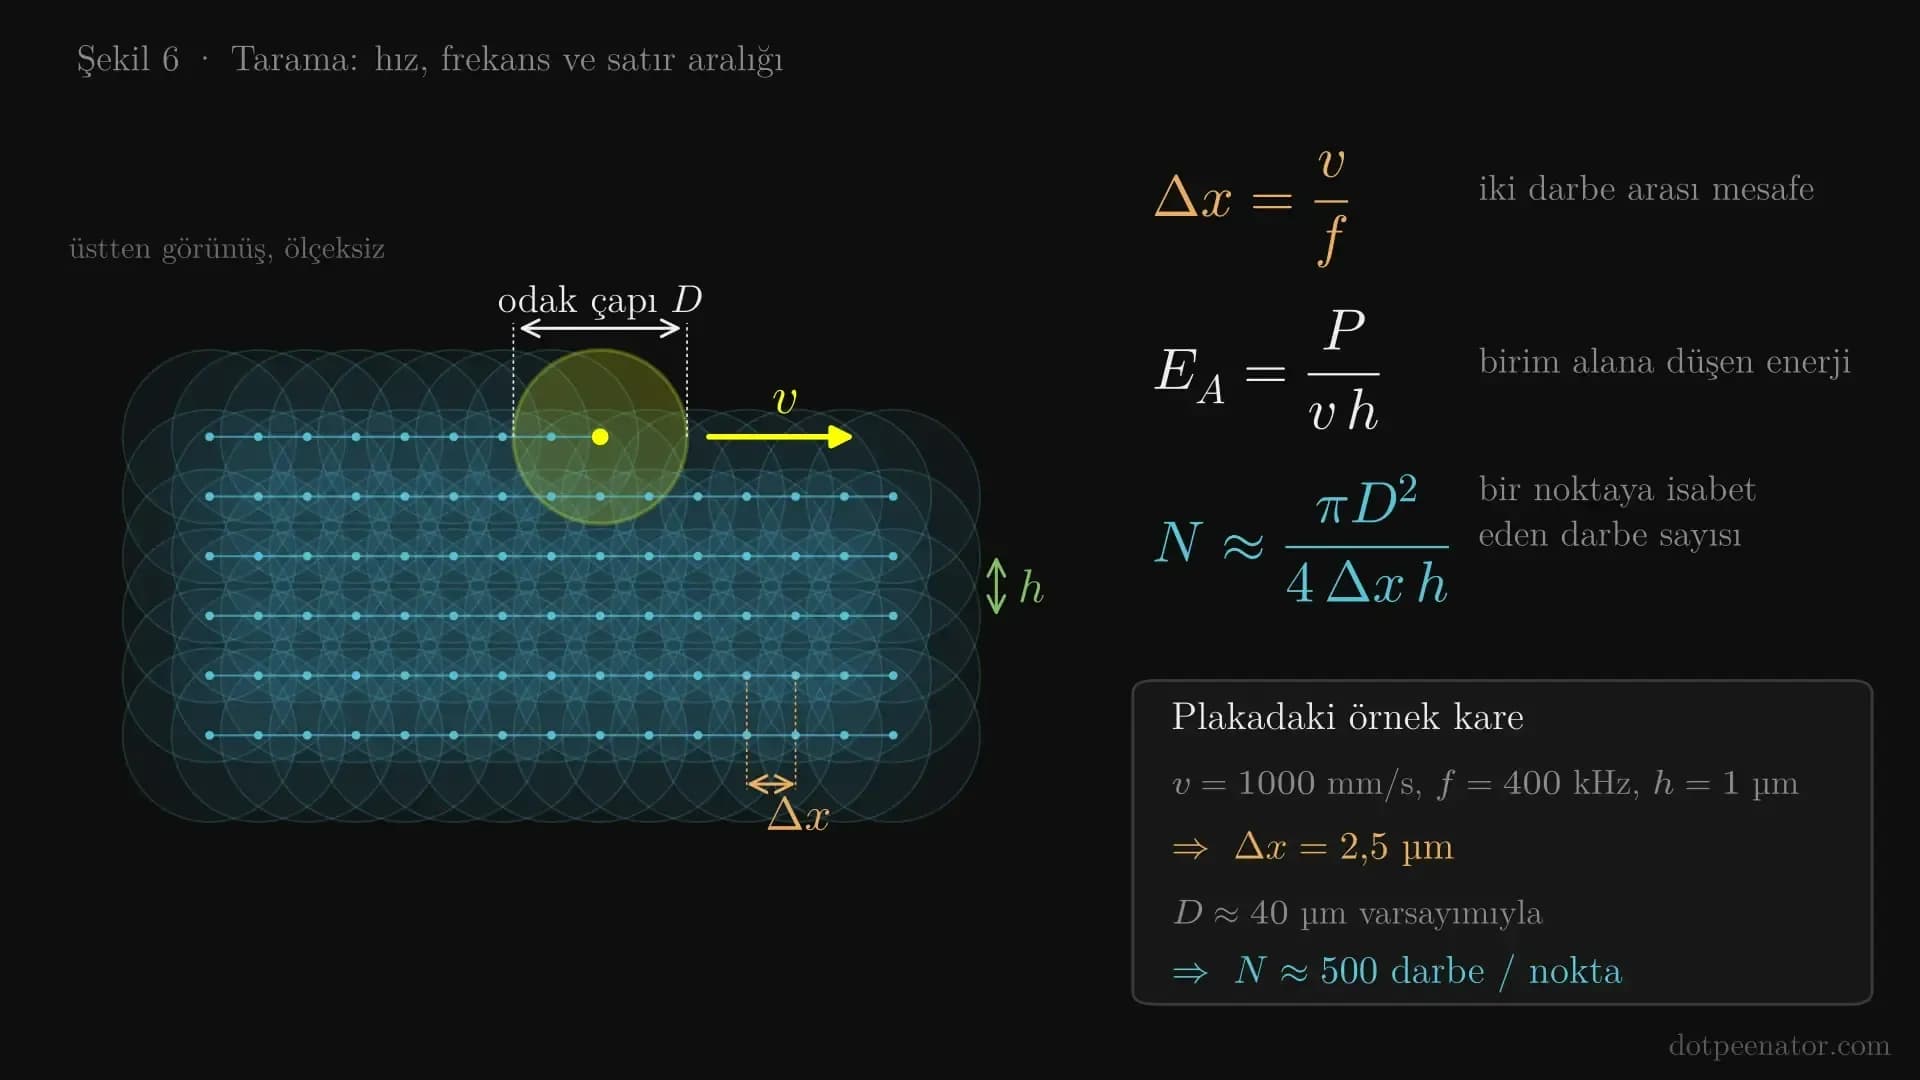
Three relationships connect these parameters:
\Delta x = \frac{v}{f} \qquad E_A = \frac{P}{v\,h} \qquad N \approx \frac{\pi D^2}{4\,\Delta x\,h}
Δx is the distance between consecutive pulses, E_A is the energy density per unit area, and N is the number of pulses overlapping a single spot (D: focal spot diameter). For the purple square on our plate, the scan speed is 1000 mm/s, frequency is 400 kHz, and line pitch is 0.001 mm. Under these settings, pulses land 2.5 µm apart. Assuming a focal spot diameter of roughly 40 µm, every point on the surface receives heat from approximately 500 pulses. The oxide layer grows incrementally with these cycles; since it is diffusion-limited, growth slows as thickness increases.
The 16 parameters of our test plate
Squares on the plate are numbered from left to right, top to bottom. Color names correspond to photo B. Power is expressed as a percentage of the laser source's nominal power. The last two columns are relative values calculated for comparison: P/(v·h) represents energy per unit area, and P/f represents energy per pulse.
# | Perceived color (B) | Speed (mm/s) | Power (%) | Frequency (kHz) | Pulse (ns) | Line pitch (mm) | P/(v·h) rel. | P/f rel. |
|---|---|---|---|---|---|---|---|---|
1 | light pink-lilac | 600 | 40 | 300 | 45 | 0.002 | 33 | 13 |
2 | turquoise | 1500 | 40 | 350 | 13 | 0.001 | 27 | 11 |
3 | fuchsia | 400 | 42 | 190 | 80 | 0.005 | 21 | 22 |
4 | purple | 1000 | 55 | 400 | 2 | 0.001 | 55 | 14 |
5 | mint green | 1000 | 65 | 400 | 20 | 0.003 | 22 | 16 |
6 | gray-purple | 1000 | 52 | 500 | 45 | 0.001 | 52 | 10 |
7 | indigo | 125 | 80 | 300 | 2 | 0.002 | 320 | 27 |
8 | copper | 2600 | 80 | 400 | 13 | 0.002 | 15 | 20 |
9 | dusty rose | 1000 | 70 | 450 | 2 | 0.002 | 35 | 16 |
10 | green-turquoise | 1500 | 60 | 480 | 13 | 0.001 | 40 | 12 |
11 | red | 1500 | 75 | 1000 | 1 | 0.002 | 25 | 7.5 |
12 | golden olive | 1000 | 52 | 130 | 9 | 0.002 | 26 | 40 |
13 | lavender | 1000 | 42 | 500 | 4 | 0.001 | 42 | 8.4 |
14 | light blue | 2000 | 80 | 200 | 4 | 0.002 | 20 | 40 |
15 | orange | 1000 | 60 | 600 | 2 | 0.001 | 60 | 10 |
16 | dark purple | 165 | 75 | 300 | 2 | 0.01 | 45 | 25 |
The most crucial takeaway from the table is this: Energy per unit area alone does not determine the color. In squares 2, 11, and 12, P/(v·h) is virtually identical (25–27). Yet one resulted in turquoise, another in red, and the third in golden olive. The difference is driven by pulse energy (ranging from 7.5 to 40) and pulse duration (1–13 ns). This is precisely the control knob you do not have with a Q-switched laser.
Do not copy these values directly onto your machine. A laser source with different wattage, a different lens, or a different grade of steel will not produce identical colors. This table serves as a starting point for establishing your own test matrix.
Practical tips and limitations
- Material: Best results are achieved on stainless steel (304, 316) and titanium. Titanium offers a wider color range that is easier to control. Carbon steel also yields annealing colors, but the surface remains susceptible to corrosion.
- Surface preparation: The surface must be clean and degreased. Brushed and mirror-polished surfaces produce different shades with identical parameters; create your test plates using your actual production finish.
- Focus and flatness: Minor focal deviations alter energy density and consequently change the color. Sheet metals thinner than 1 mm can warp under heat; clamp the workpiece securely.
- Heat accumulation: On large areas, the part heats up as marking progresses, causing colors to drift. Mitigate this by dividing areas, inserting cooling pauses, or alternating scanning directions.
- Repeatability: Establish your own parameter matrix for each machine, lens, and material combination. Our 16-square plate is an example of such a matrix.
- Durability: The oxide layer is permanent and cannot be easily rubbed off. However, abrasive cleaning and high temperatures can alter the color. High heat input may also diminish the corrosion resistance of stainless steel. Be sure to test this thoroughly for outdoor or food-contact parts.
Color laser marking is widely used on logos, decorative nameplates, jewelry and watch components, color coding of surgical instruments, and promotional gifts. However, for applications where readability is paramount—such as serial numbers or DataMatrix codes—high-contrast black marking is generally the preferred choice.
Frequently asked questions
Is a MOPA laser mandatory for color laser marking?
For a wide and repeatable color palette, yes. Color is controlled by simultaneously fine-tuning pulse duration and pulse energy. While a Q-switched laser can generate a few annealing colors, reliably reproducing shades like blue, turquoise, and green is extremely difficult.
Which metals can be color laser marked?
The most common are stainless steel and titanium. Steels containing chromium are ideal because they form stable, transparent oxides. This method does not produce color on aluminum; however, on anodized aluminum, MOPA lasers can produce black and white markings.
Are the colors permanent?
Yes. The color originates from the oxide layer grown directly on the metal surface; it does not flake off like paint. However, abrasive cleaning, harsh chemicals, and elevated temperatures can alter the color by thinning or thickening the layer.
Do identical parameters yield the same color on every machine?
No. Power is set as a percentage and depends on the laser source's nominal wattage. Lens specifications, focal spot diameter, material grade, and surface finish also influence results. A dedicated test matrix must be developed for each setup.
How many different colors can be achieved?
Dozens of distinct shades can be achieved on stainless steel. On our test plate, 16 different parameter sets yielded 16 distinct shades. Pure white and pure black cannot be obtained via thin-film interference.
Why does the color change depending on the viewing angle?
At an oblique angle, the optical path difference traveled by light within the oxide is shortened. The layer behaves as if it were thinner, shifting the color spectrum toward shorter wavelengths. This is the clearest indication that the color originates from interference rather than pigment.
Conclusion
Color laser marking is not a painting process; it is a nanoscale oxide growth process. The color is governed by oxide thickness, which in turn is determined by the thermal dose delivered by the laser and how that dose is distributed. By enabling independent adjustment of pulse duration and frequency, MOPA fiber lasers allow you to fine-tune this thermal dose with precision.
At SERMATEK, we test our fiber laser marking machines in our own workshop and collaborate with our customers to develop customized parameter sets. If you would like to discuss whether color laser marking is suitable for your components, contact us: (0232) 472 23 43 · info@markalama.com
References
- Lu Y. et al., "Nanosecond laser coloration on stainless steel surface", Scientific Reports 7, 7092 (2017)
- HiPA Photonics Japan (JPT), M7 MOPA fiber laser product page
- Diagrams: air / Cr–Fe oxide / stainless steel single-layer thin-film model (Fresnel–Airy reflection, CIE 1931 color matching functions, D65 illuminant). Colors are for illustrative purposes; real thickness-color correlation may shift based on material and oxide composition.